| | |
|
Simulated IFU observations of z~9, JAB=29 Lyman Alpha Emitters. Top panel: an integrated spectrum was constructed from the simulated IFU observations. The resulting spectrum shows the line can be detected after a 10 hr exposure time with MOSAIC IFUs on the ELT. Bottom panel: same simulations using a 0.4 arcsec mono-fiber aperture.
| |
| | |
|
| | |
|
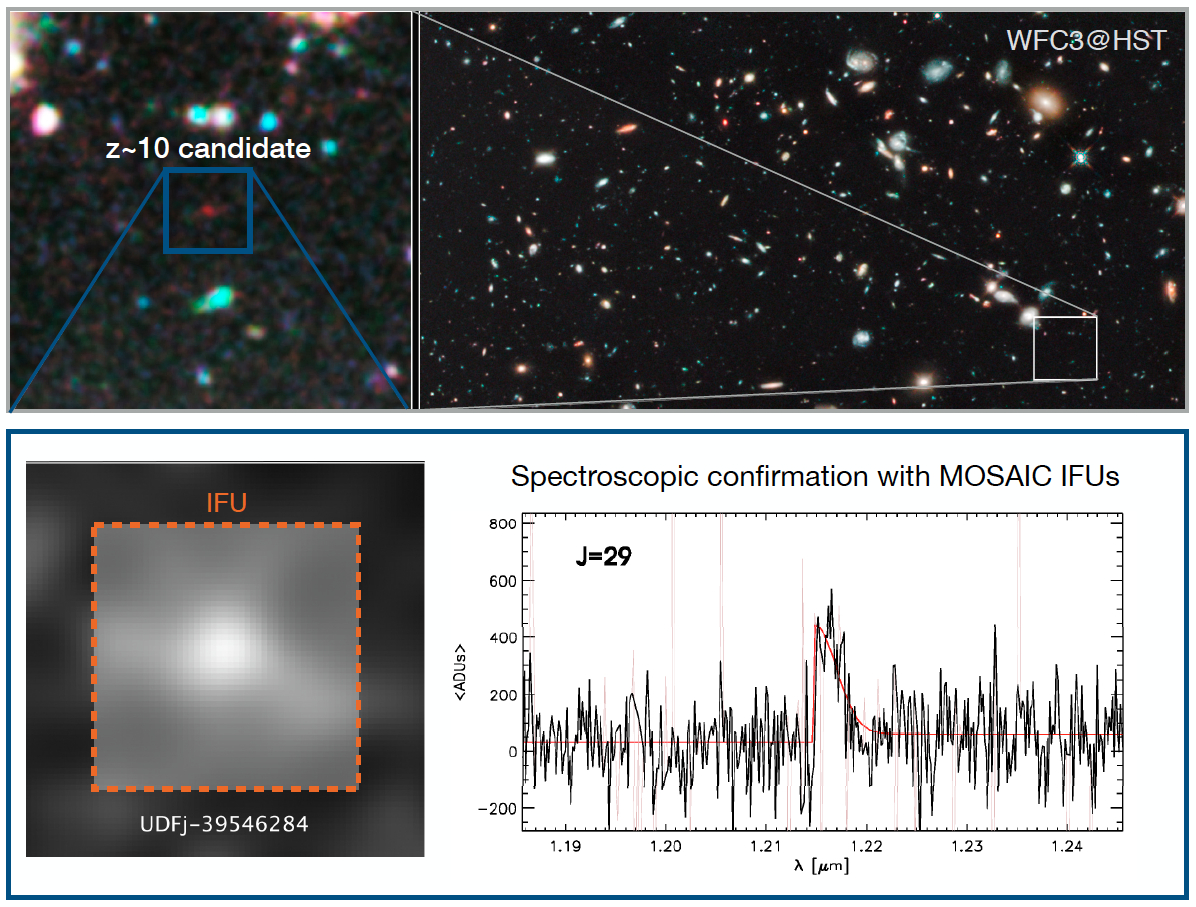
Upper panel: z~10 candidate in the Hubble Ultra Deep FIeld (Bouwens et al. 2011). Lower panel: Planned followup of the z~10 candidate with the MOSAIC IFU (left). The expected spectra of the candidate as observed by MOSAIC at ELT in 10h of integration time is shown ih the lower right panel (Disseau et al. 2014).
Adapted from Hubble Ultra Deep Field 2009-2010 and UDFj-39546284. Credit: NASA, ESA, G. Illingworth (University of California, Santa Cruz), R. Bouwens (University of California, Santa Cruz, and Leiden University), and the HUDF09 Team.
| |
| | |
|

